![[Translate to Englisch:] Ein grünes Fußballfeld. Links und rechts sind mit weißen Linien schematisch die Tore eingezeichnet. Über dem Feld liegen mehrere rote und blaue Linien, die die Laufwege von Spielerinnen und Spielern darstellen.](https://www.tugraz.at/fileadmin/_processed_/8/1/csm_Sportdatenvisualisierung_01_by_CGV_aec5bebbdd.png)

Over-plotting, or what am I supposed to make of that?
‘What you see here is so-called “over-plotting”. This is what 90 minutes worth of movement data of 22 persons looks like when completely superimposed. Of course, no meaningful analysis is possible,’ explains the German-born professor in his office in Graz’s Inffeldgasse 16. To unravel this colourful ball of yarn, the team utilises a wide range of approaches using <link https: www.tugraz.at institute cgv schreck visual-analytics _blank int-link-external external link in new>analytic visualisation and abstraction. In other words, single movements are filtered out of the game, specific game situations sought, free spaces indicated and similar movement patterns clustered by using a wide range of methods. In this way, for example, statements about the basic tenor of a match can be made – like whether the team played very defensively or did in fact go on the offensive, what moves were most often used, where the players were most of the time or where they came under pressure.In the video <link https: www.youtube.com _blank int-link-external external link in new>„Dynamic Visual Abstraction of Soccer Movement“ you can see how the visualization system works live.
Camera as movement tracker
But before these statements can be made, the movement data has to be gathered. ‘Up to now we’ve worked mostly with complete datasets. A lot of things are available due to the high professionalisation of football. All the big clubs work with video analysts, and we can build on their work,’ explains Tobias Schreck. Horst Possegger, doctoral student at the <link https: www.tugraz.at institute icg home _blank int-link-external external link in new>Institute for Computer Graphics and Vision, works a few offices away. He specialises in tracking moving persons in video recordings and was involved in the MASA project in 2013 in which movement data was generated from the recording of a handball game. ‘This technology can also be used in football,’ he explains. ‘We work with several cameras so we can find the right position even when two people conceal each other. The system also uses the 3D structure of the scene, which can be reconstructed in real time using several cameras.’ A special colour scheme is calculated for each person on the pitch so that they can be followed. The problem of the large number of people in such a small space could be solved using a particle filter together with a Voronoi partition. The particles ‘stick’ to one person and can only move within a particular framework. By means of the predetermined boundaries, the identities can also be determined when two players come very close to each other, as in attacking or defensive situations.Video: This is how <link https: vimeo.com _blank int-link-external external link in new>tracking in handball works as developed at TU Graz
Today the young researcher works on a very similar tracking approach, but in a very much slower kind of sport: walking. An automatic traffic light system is currently being set up at the Institute in which the buttons at the pedestrian lights are replaced by a camera with a movement detector and a sophisticated system for predicting the direction of movement. ‘The traffic light system which we developed only reacts when a person really wants to cross the zebra crossing. It also takes into account how many persons want to cross. If several persons want to cross the road, the green phase is automatically extended,’ explains Possegger. It has already been proved in a feasibility study that the system developed at TU Graz works. The traffic light system was triggered off correctly in 99.5 per cent of cases. ‘We are presently in talks with our partners from industry and would like to implement the system in real terms in the next few years.’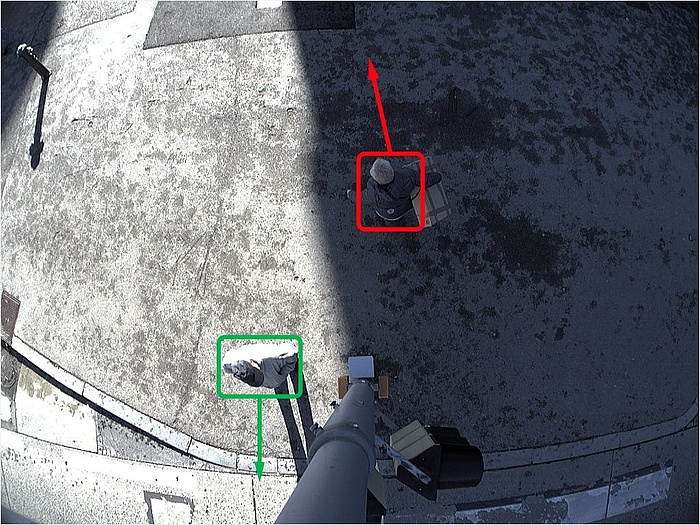
A search engine for movements
But back to sport and a lot more speed: football. When the data has been collected, Tobias Schreck and his team transform it into meaningful analyses and visualisations. Each of their systems is interactive and can be adapted to the relevant questions of the users. For example – the search machine for movements, which searches for particular movement patterns outlined by users over 90 minutes of playing time. The desired movement can be outlined on a schematically represented playing field by mouse click. For instance, player 1 runs from position A to position B, or player 1 intercepts player 2 on his or her way from position A to position B. ‘In this way, for example, you can find out which players carried out which moves and how successful they were. For example, you can see which defenders can play especially offensively by defining the starting point of the movement in front of the home goal and the end point in front of the opponents’ goal. And you can do a lot more with it,’ says Schreck, convinced of its many possibilities. Lin Shao und co-autoren und SPIE. Quelle: L. Shao, D. Sacha, B. Neldner, M. Stein, and T. Schreck. Visual-interactive search for soccer trajectories to identify interesting game situations. In Proc. SPIE Conference on Visualization and Data Analysis, 2016.")
 Manuel Stein und Co-autoren und IEEE. Quelle: M. Stein, H. Janetzko, T. Breitkreutz, D. Seebacher, T. Schreck, M. Grossniklaus,I. Couzin, and D. Keim. Director's Cut: Analysis and Annotation of Soccer Matches.Computer Graphics and Applications, 36(5):50{60, 2016. Special Issue on Sports DataVisualization.")
From ball of wool to meaningful analysis over 90 minutes
If you want to grasp the gist of the whole 90 minutes of play, then you have to use a method of abstraction. Cluster analysis enables 90 minutes of a wide variety of motion sequences to be summarised into the main kinds of movement, and the respective tactics, strategy and actually implemented game moves illustrated. ‘One important question is what is similarity?’ explains Schreck. ‘Similar movement sequences are summarised using cluster analyses. But what does “similar” mean here? Is it similar when a player zigzags in a particular direction and another player runs in a straight line, but both start from the same point and finish at the same point? Or is it more similar when two persons start from different points and arrive at different points, but both run in a straight line? Both answers are right. Because it always depends on the question with which the analysis is begun. For this reason our systems can always be individually adapted to the question by means of interactive techniques.’A look into the future
The idea is to go a step further in the future and expand the analysis by including the players’ vital parameters. ‘In the future, we would like to work with colleagues who have developed sports shirts with sophisticated sensors and use them to track pulse, stress level and similar things,’ explains Schreck. ‘When we combine this data with our analyses, we will be able to make statements, for example, as to why a player didn’t score a goal. Perhaps he didn’t have any energy left, or perhaps the stress level was too high or something similar.’ Furthermore, we want to develop the visualisation system to such a degree that calculations can be made in real time and the additional data can be faded in to a live image of a broadcast of a match. And Tobias Schreck dreams of massively expanded data sets: ‘It would be a dream if, for instance, we could analyse all the movement data of all the players in one season and make them comparable to each other.’ The research at Graz and Konstanz is located in the basic research area, but Big Data is becoming an increasingly important field in football and there is a terrific interest on the part of the big clubs for new evaluation technologies. ‘We are constantly talking to game analysts and coaches – for instance with a former youth coach of Bayern Munich. In a qualitative evaluation he confirmed to us how important the topic of video analysis already is and how it will become even more important in the future.’This research project is attributed to the Field of Expertise<link https: www.tugraz.at en research fields-of-expertise information-communication-computing overview-information-communication-computing _blank int-link-external external link in new> „Information, Communication & Computing“, one of TU Graz' five strategic areas of research.
Visit <link https: www.tugraz.at en tu-graz services news-stories planet-research all-articles _blank int-link-external external link in new>Planet research or more research related news..
Dr.rer.nat. M.Sc.
Institut für Computer Graphik und Wissensvisualisierung
<link int-link-mail window for sending>tobias.schreck@cgv.tugraz.at Horst POSSEGGER
Dipl.Ing. BSc.
Institut für Maschinelles Sehen und Darstellen
<link int-link-mail window for sending>possegger@icg.tugraz.at