Energy levels
The EFG can be described by a real, symmetric, traceless 3x3 tensor. Such a tensor can always be made diagonal by choosing an appropriate set of coordinate axes known as principal axes (Vxx,Vyy,Vzz) [1]. It is common to define:
eq = Vzz and η = (Vxx - Vyy) / Vzz
where η is the asymmetry parameter which indicates the degree of the deviation of the EFG from its axisymmetric shape. Usually the principal axes are chosen as follows:
|Vxx| ≤ |Vyy| ≤ |Vzz|
One of the goals of an NQR measurement is to determine the quadrupole coupling constant e2qQ and the asymmetry parameter η, which contain information about the environment surrounding the nucleus [1]. Based on this parameters conclusions with respect to changes of the chrystallographic structures can be made. In case of axial symmetry, η=0, 2*I+1 quadrupole energy levels are observable. For ease of representation we define as follows:
A = e2qQ / ( 4I ( 2I - 1 ) )
The quadrupole energy levels can be calculated as follows:EQ(m) = A * ( 3m2 - I ( I + 1 ) )
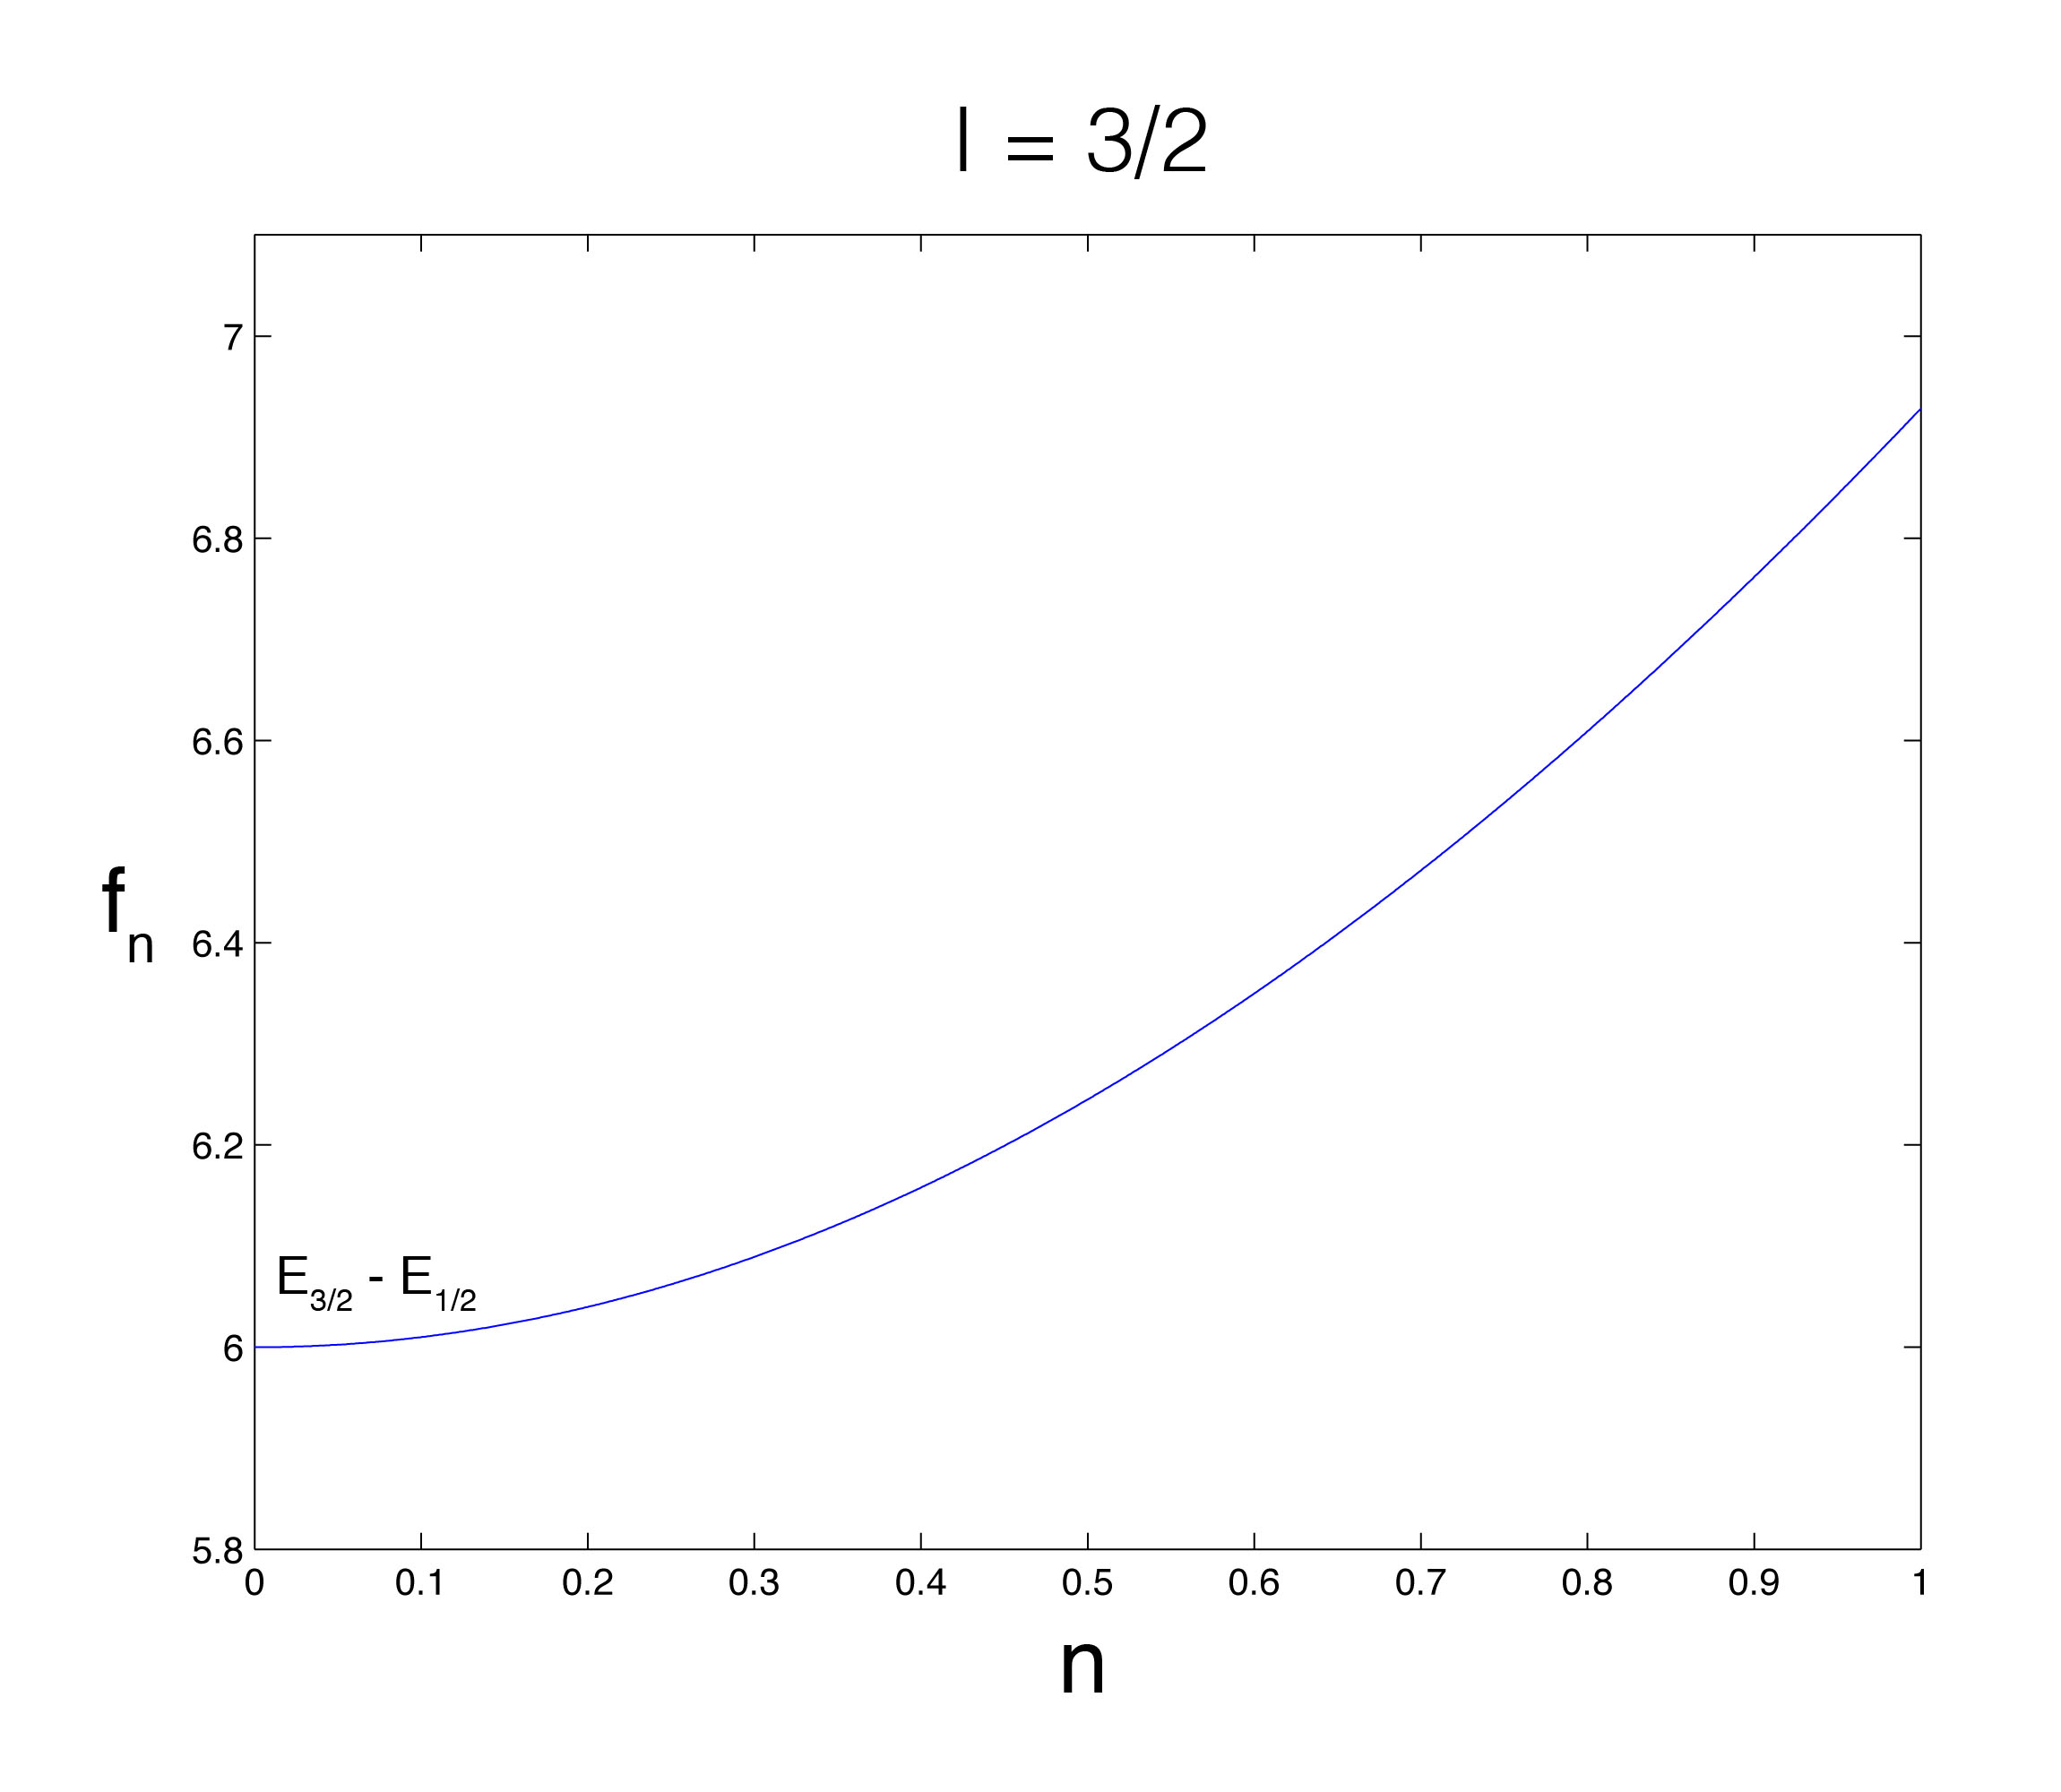
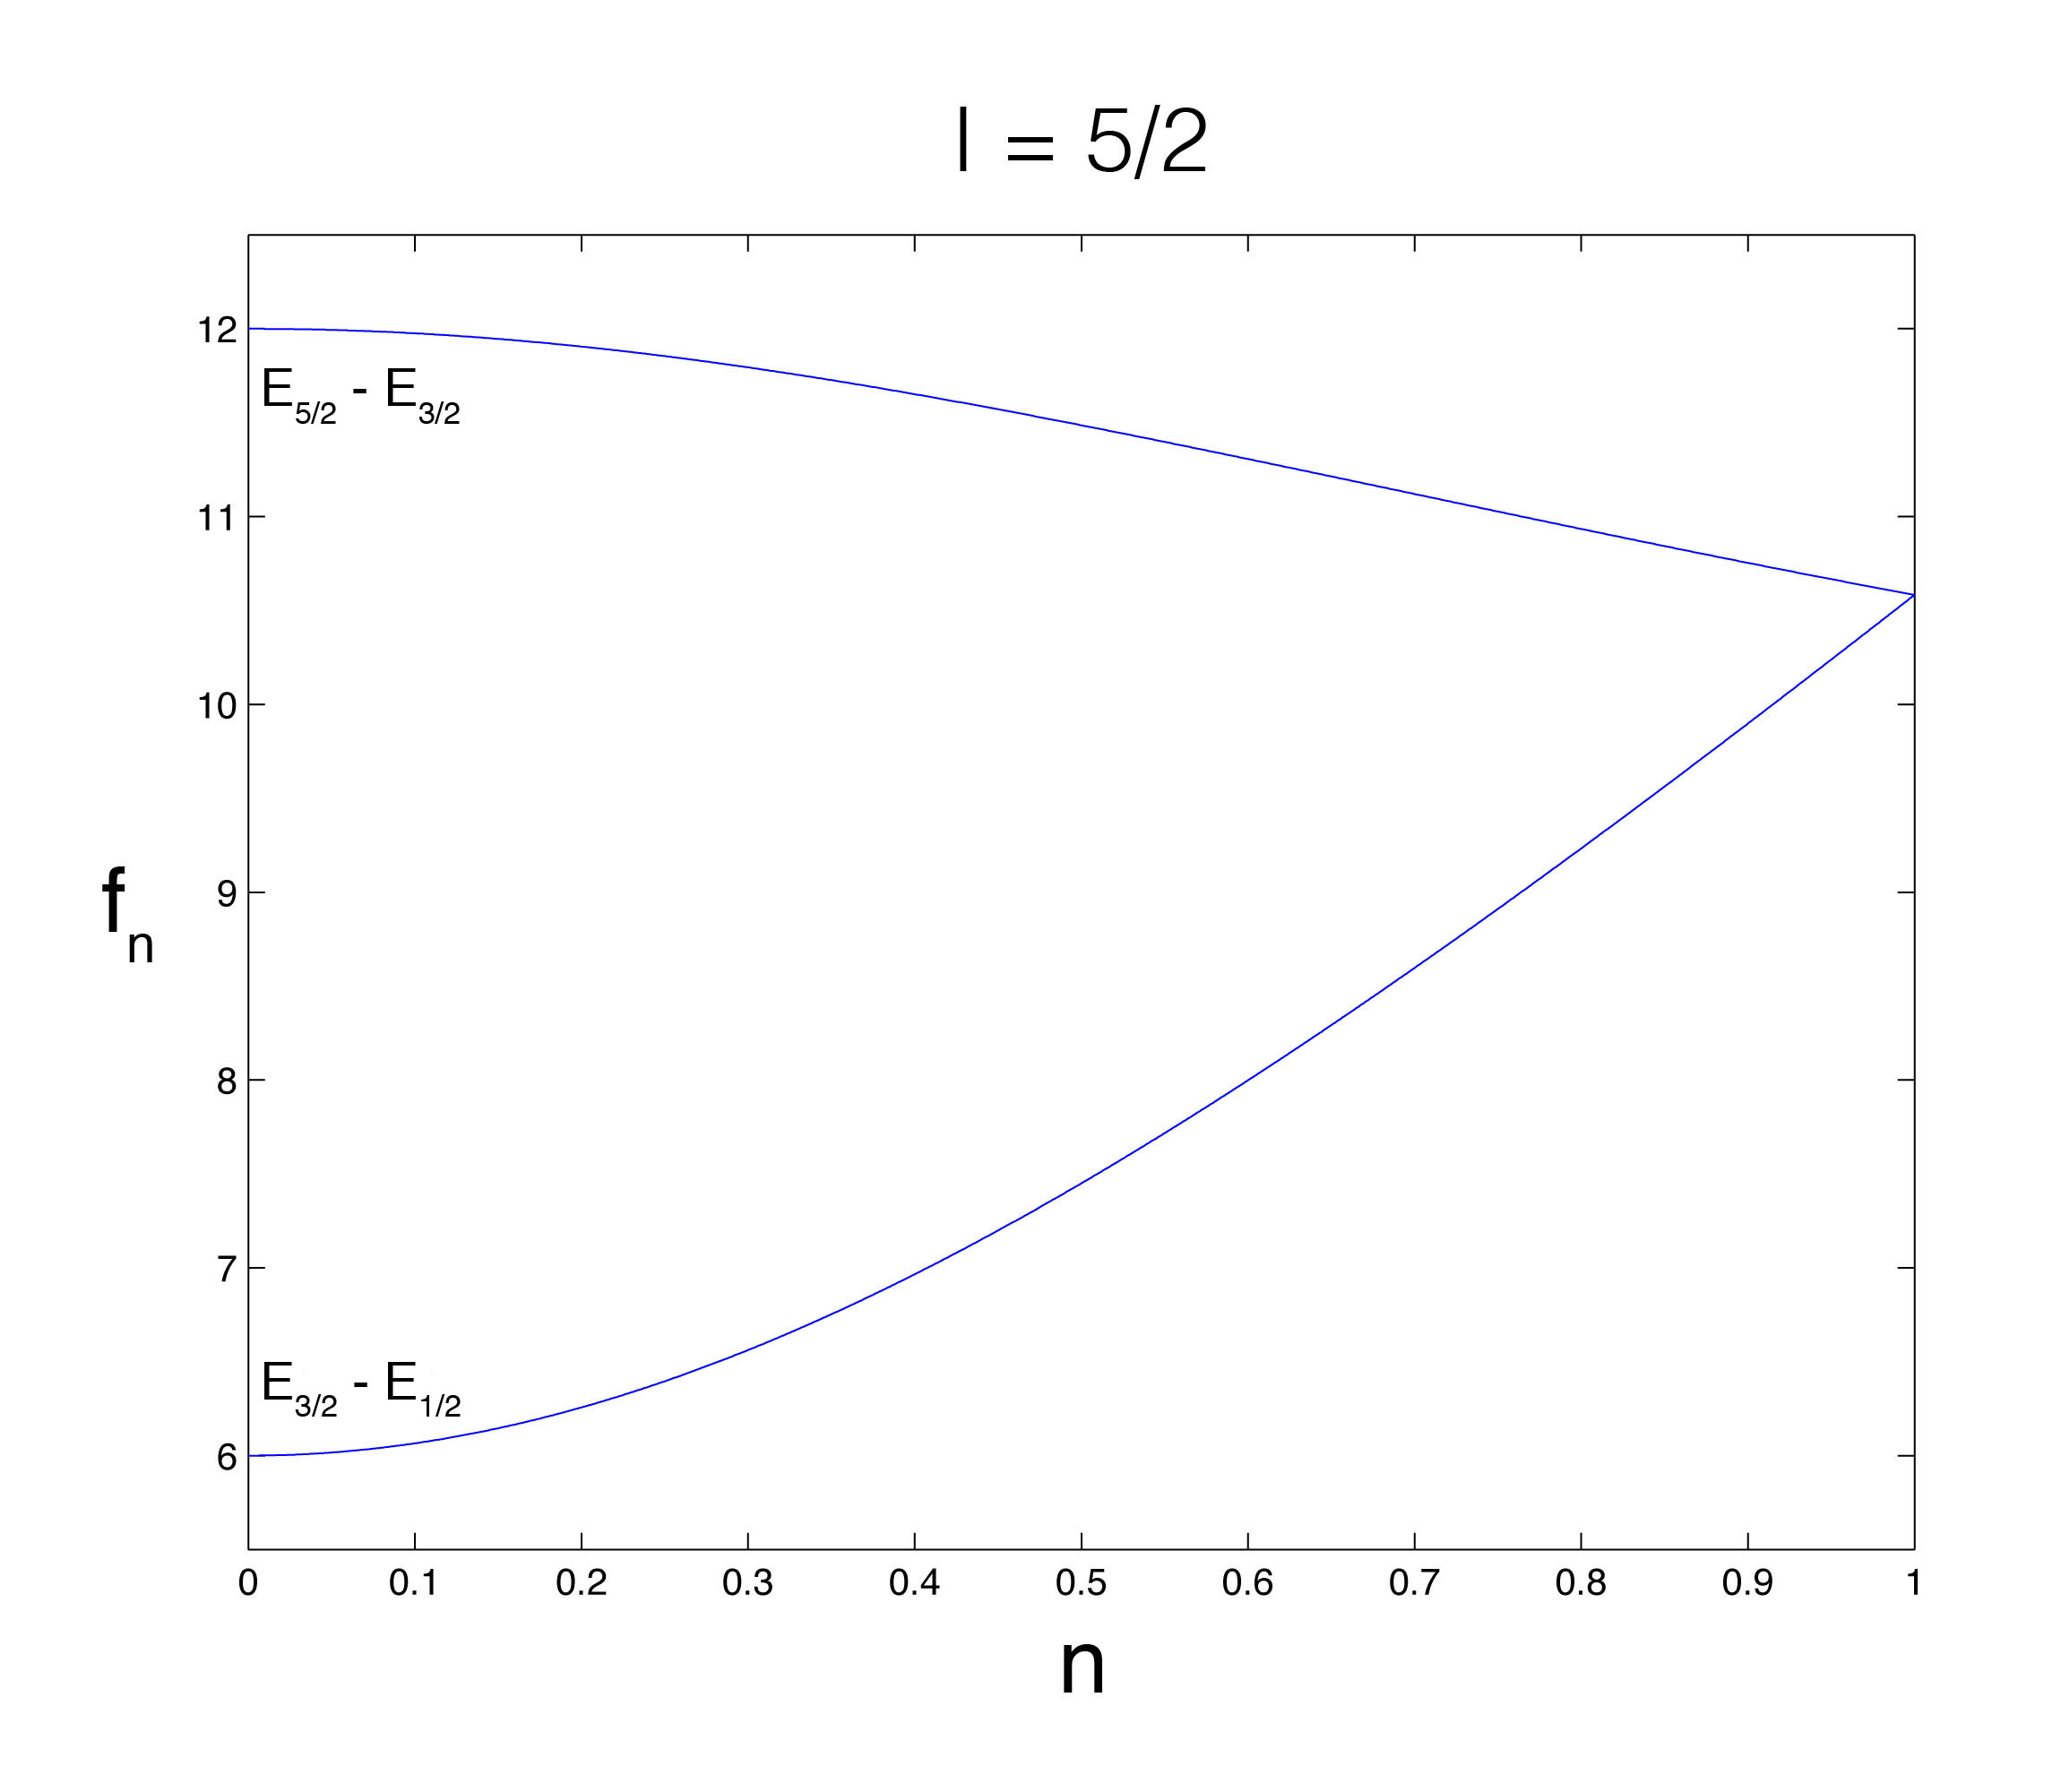
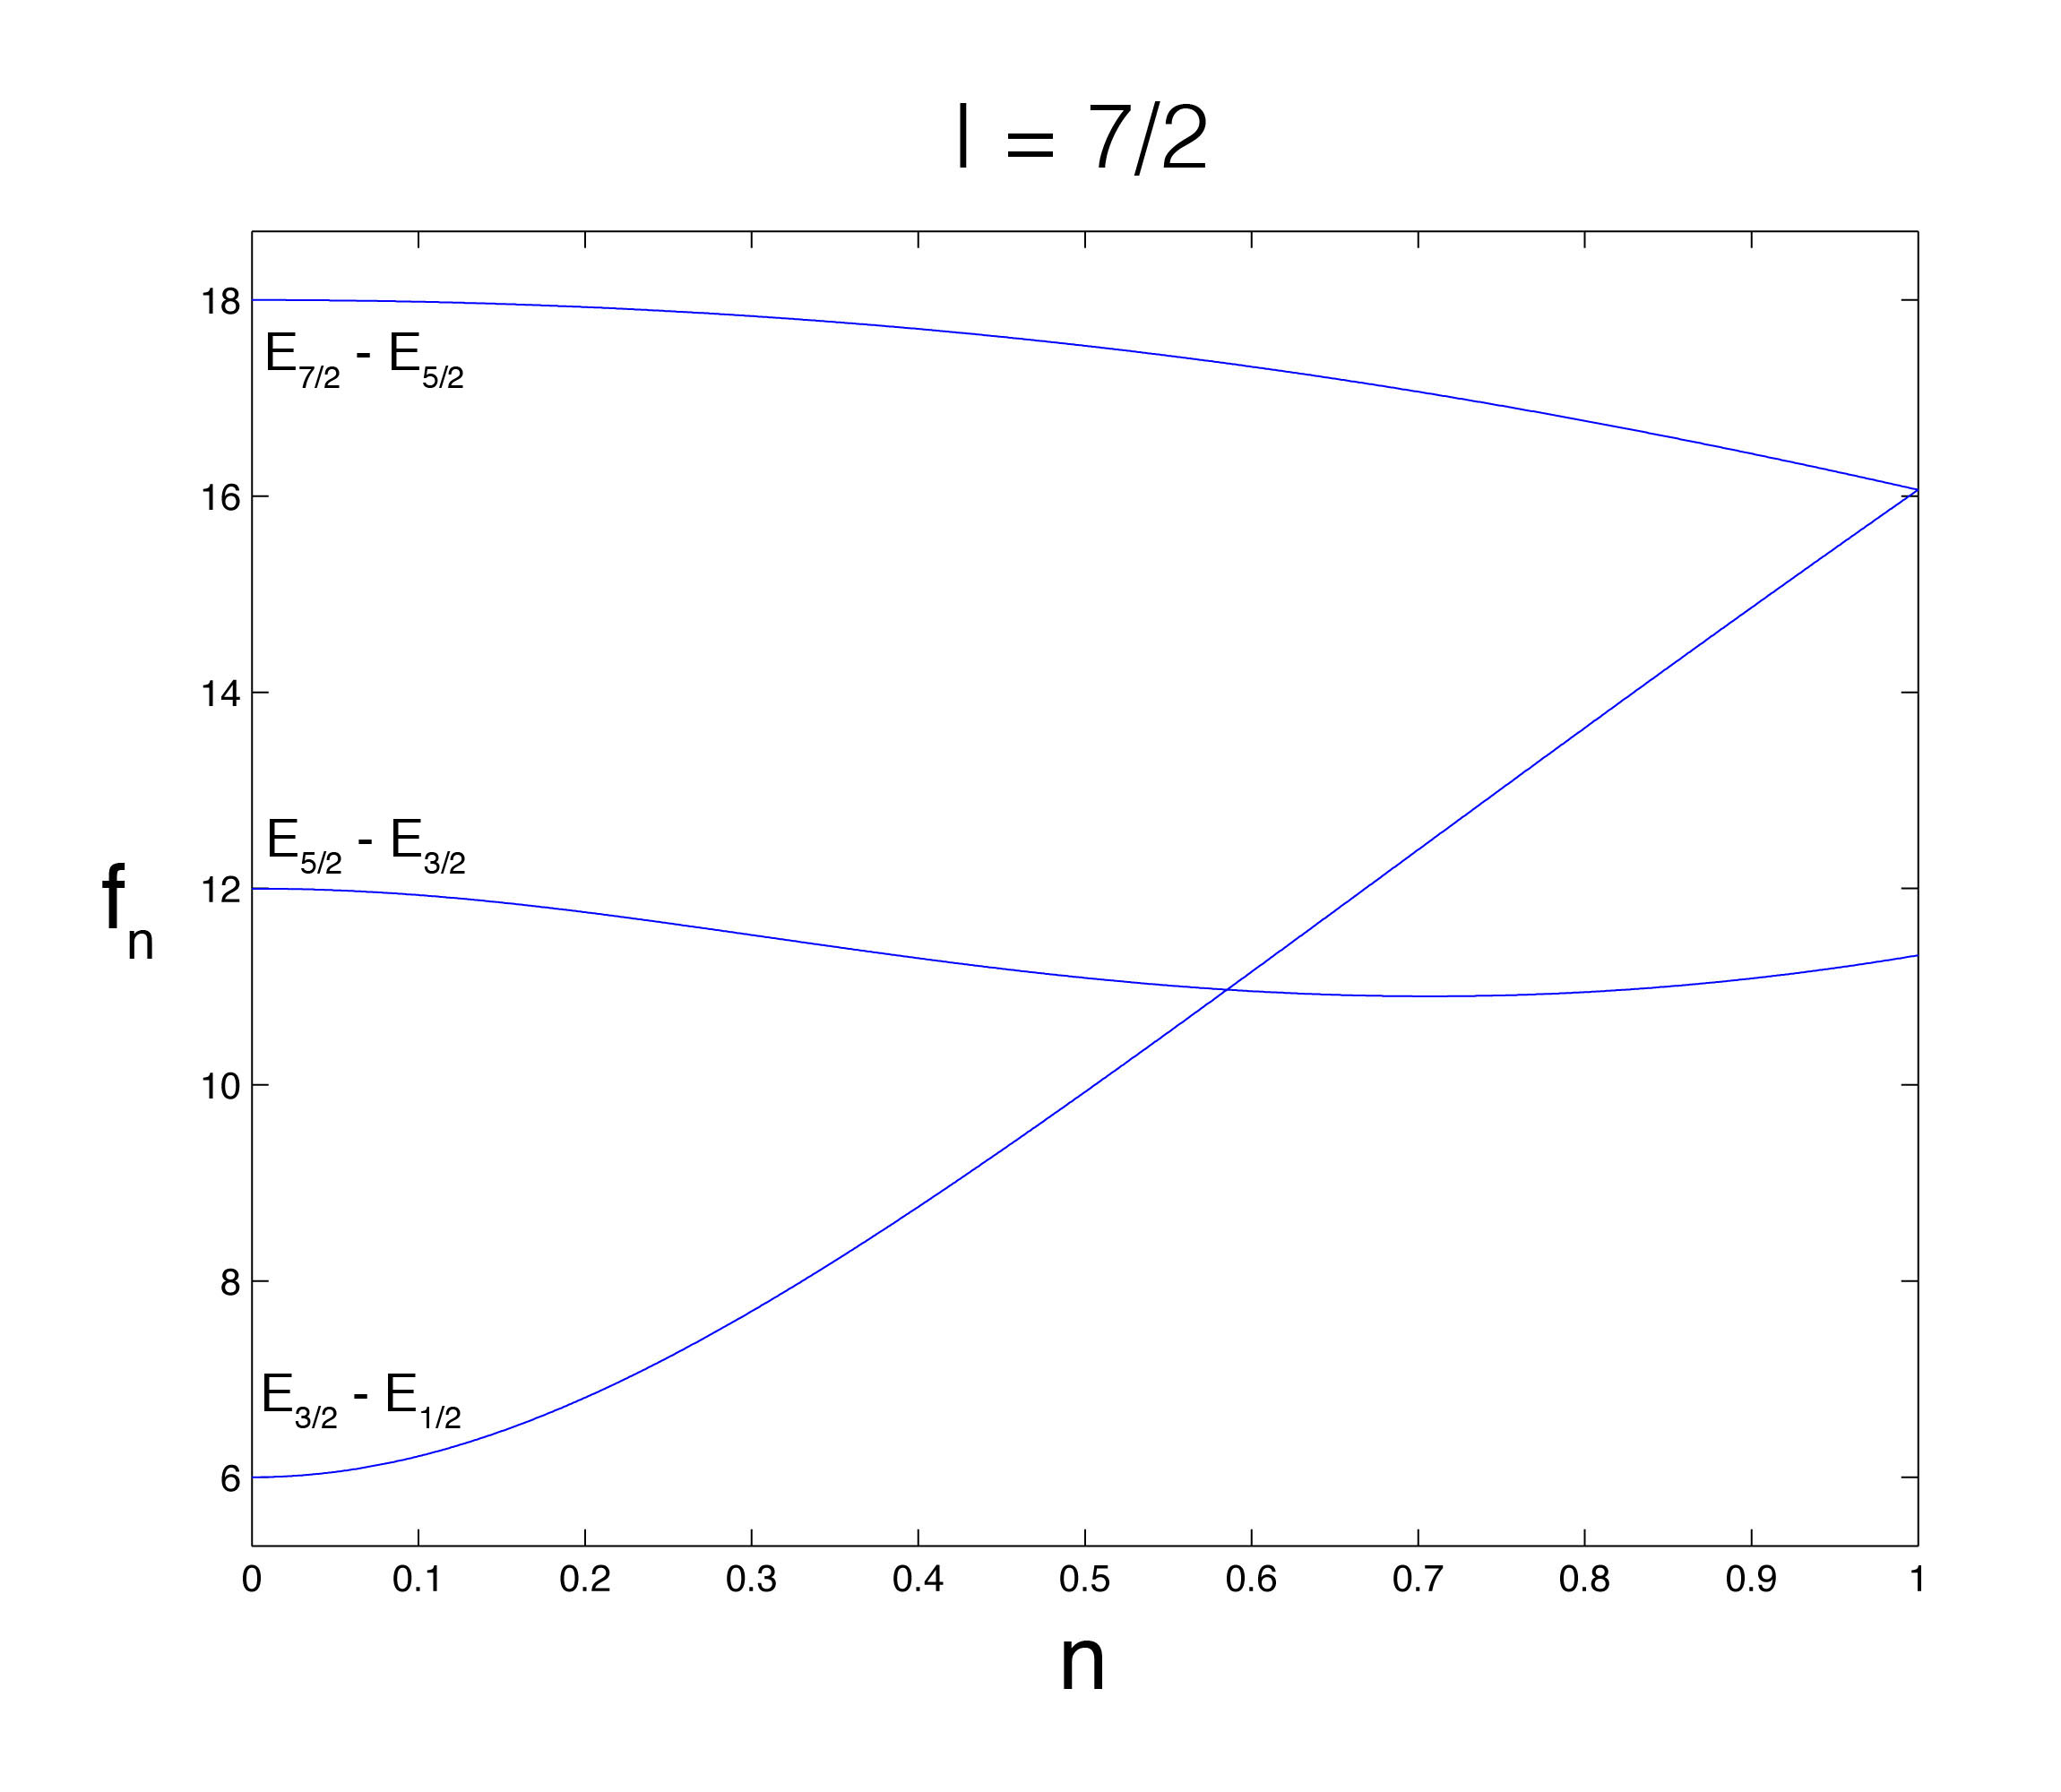
where m is the magnetic quantum number (m = -I, -I+1, ..., I-1, I). The quadrupole frequencies fQ(m-m') are corresponding to the difference between two energy levels (Em - Em'). For the more general case of η ≠ 0, a correction function fη hast to be multiplied with fQ(m-m'). If η=0, fη=1 for every kind of nucleus. For quadrupole nuclei with a higher spin quantum number I than 3/2 an exact solution for fη is not known [1]. One option to get accurate results is to use tabulated iterative calculation results. The Landolt-Börnstein tables provide an easy and precise method to determine values for quadrupole frequencies and correction functions for nuclei with spin quantum number I > 3/2. Another possibility is just to diagonalize the quadrupolar Hamiltonean numerically and calculate the respective eigenvalues for arbitraty η.
Energy and frequency spectra
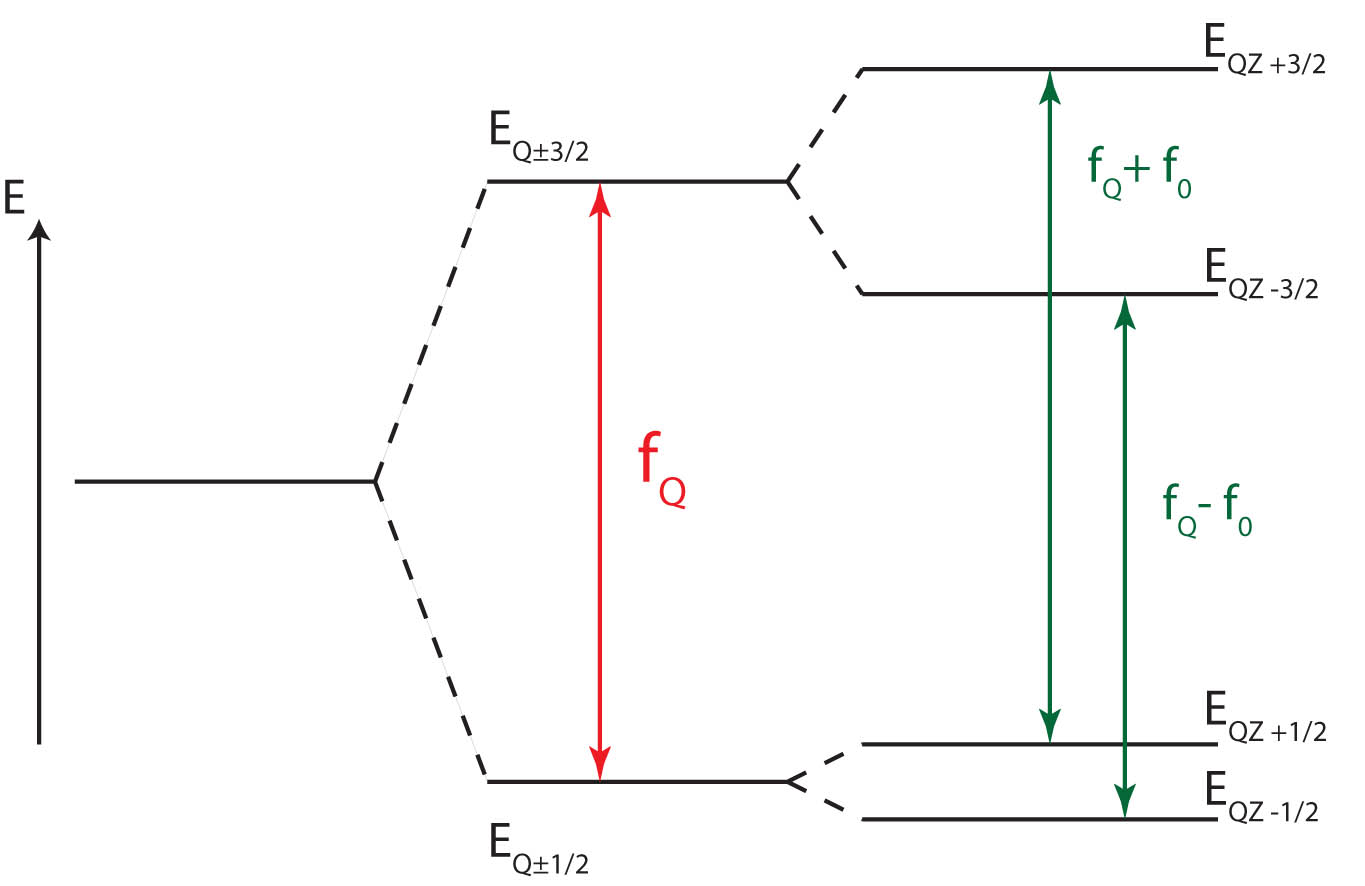
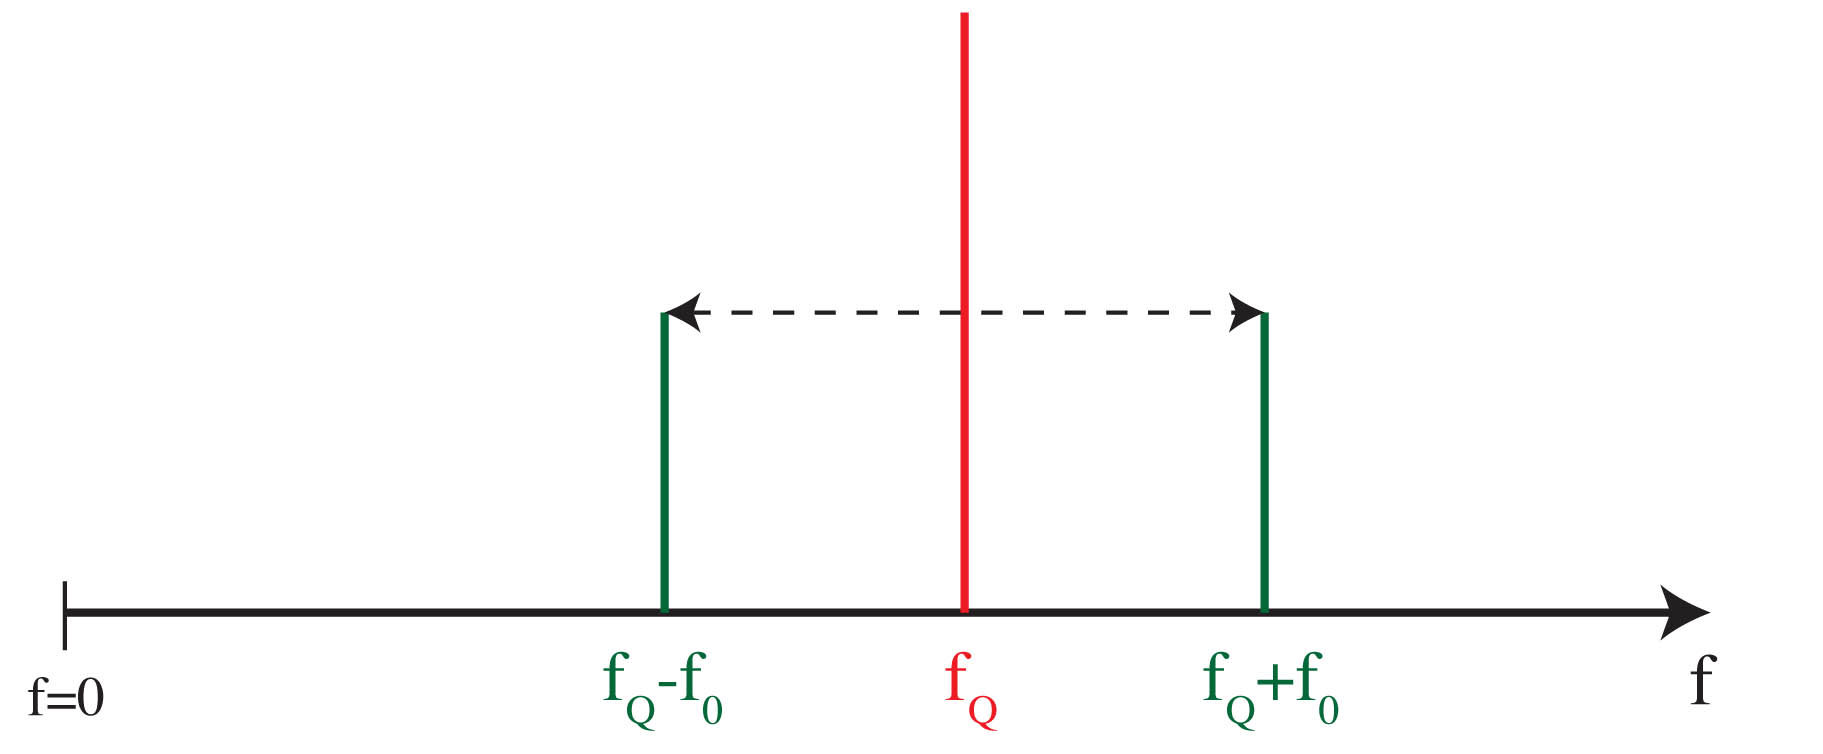
Spin 3/2 nuclei have two quadrupolar energy levels and therefore only one transition frequency [1]. Fig. 1 shows the energy spectrum in case of η=0 in the absence (EQ) and in the presence (EQZ) of an external magnetic field B0. We here assume that the quadrupolar coupling is much stronger than the Zeeman interaction. The corresponding frequency spectrum is shown in fig. 2. In the presence of a weak B0 the initial transition frequency (fQ) is split into two distinct frequencies (fQ - f0, fQ + f0). The shift frequency f0 depends on fLarmor and on the angle α between the direction of Vzz and the direction of B0.
f0 = fLarmor * cos (α)
Two discrete frequency peaks are just observable if the compounds have perfect mono-crystalline structures. In case of powders or substances with many crystalline defects the spectrum shows a broad frequency distribution (pake-doublet). The energy levels under the presence of an external magnetic field B0 can be calculated as followed:
EQZ(m) = EQ(m) + EZ(m) * cos (α)
The animation shows how the energy levels and the frequency spectrum of fig. 1 and 2 build up. It is clearly recognizable that the pure quadrupole frequency fQ disappears under the presence of an external magnetic field B0.
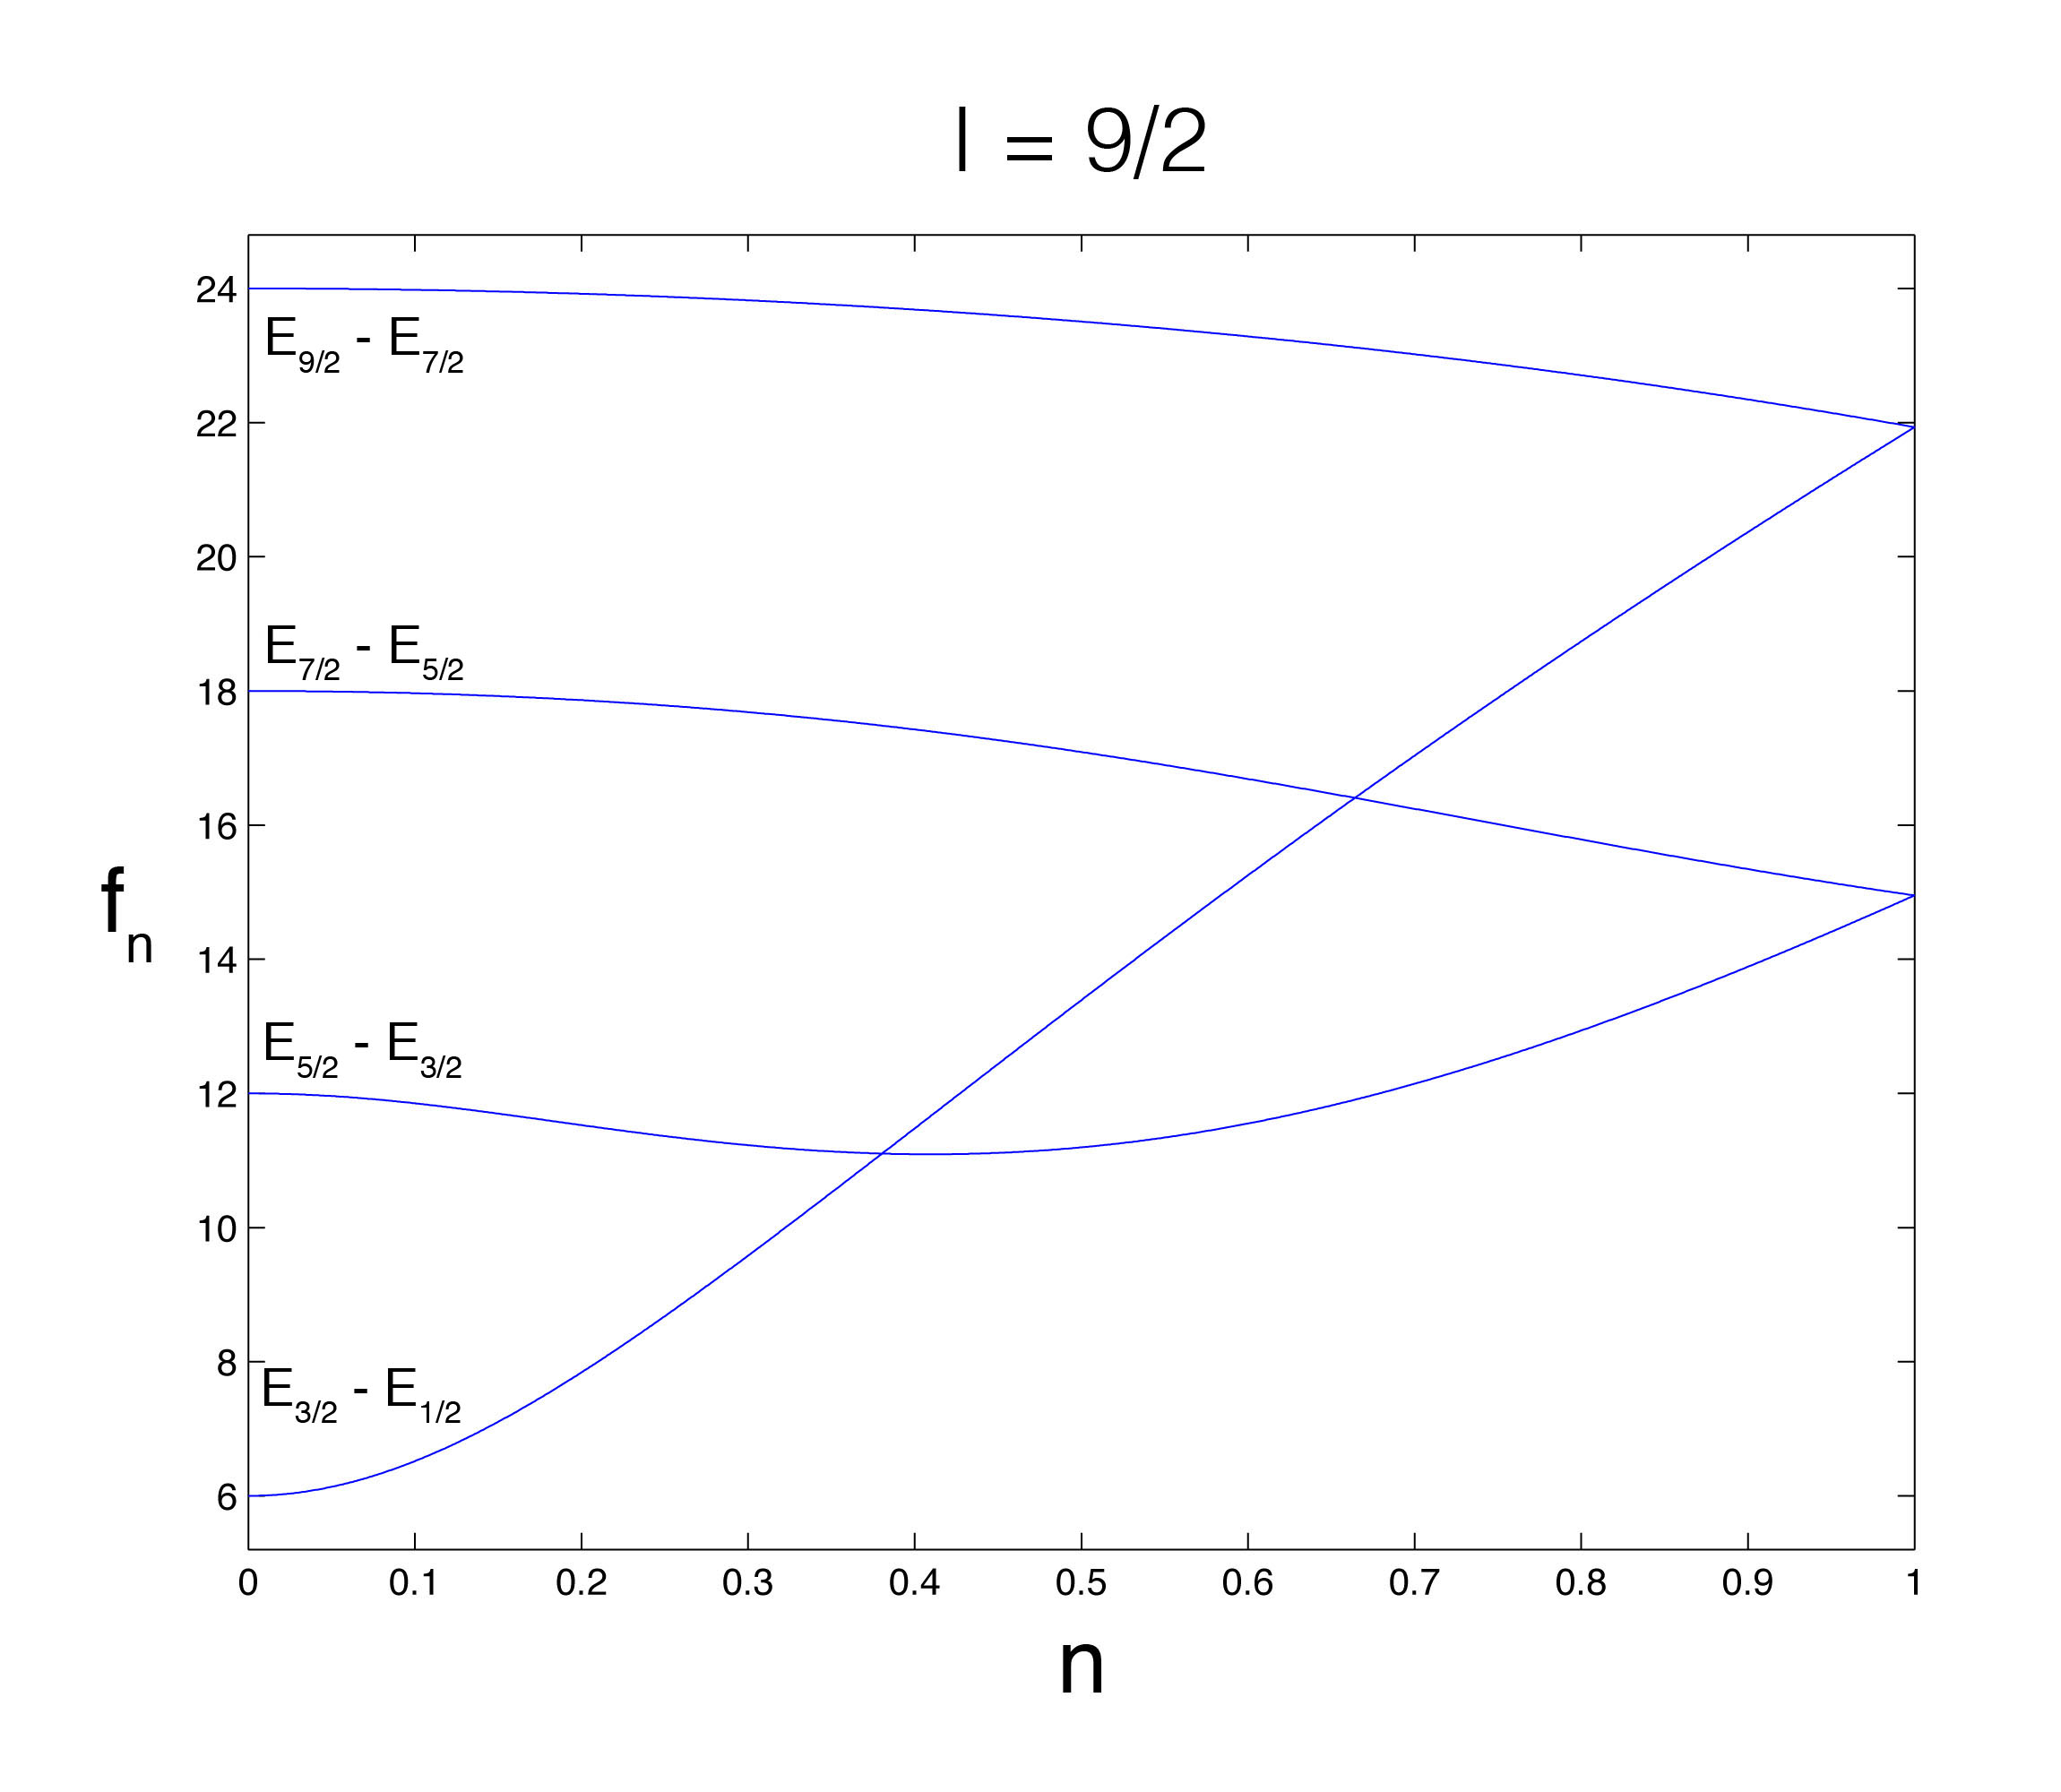
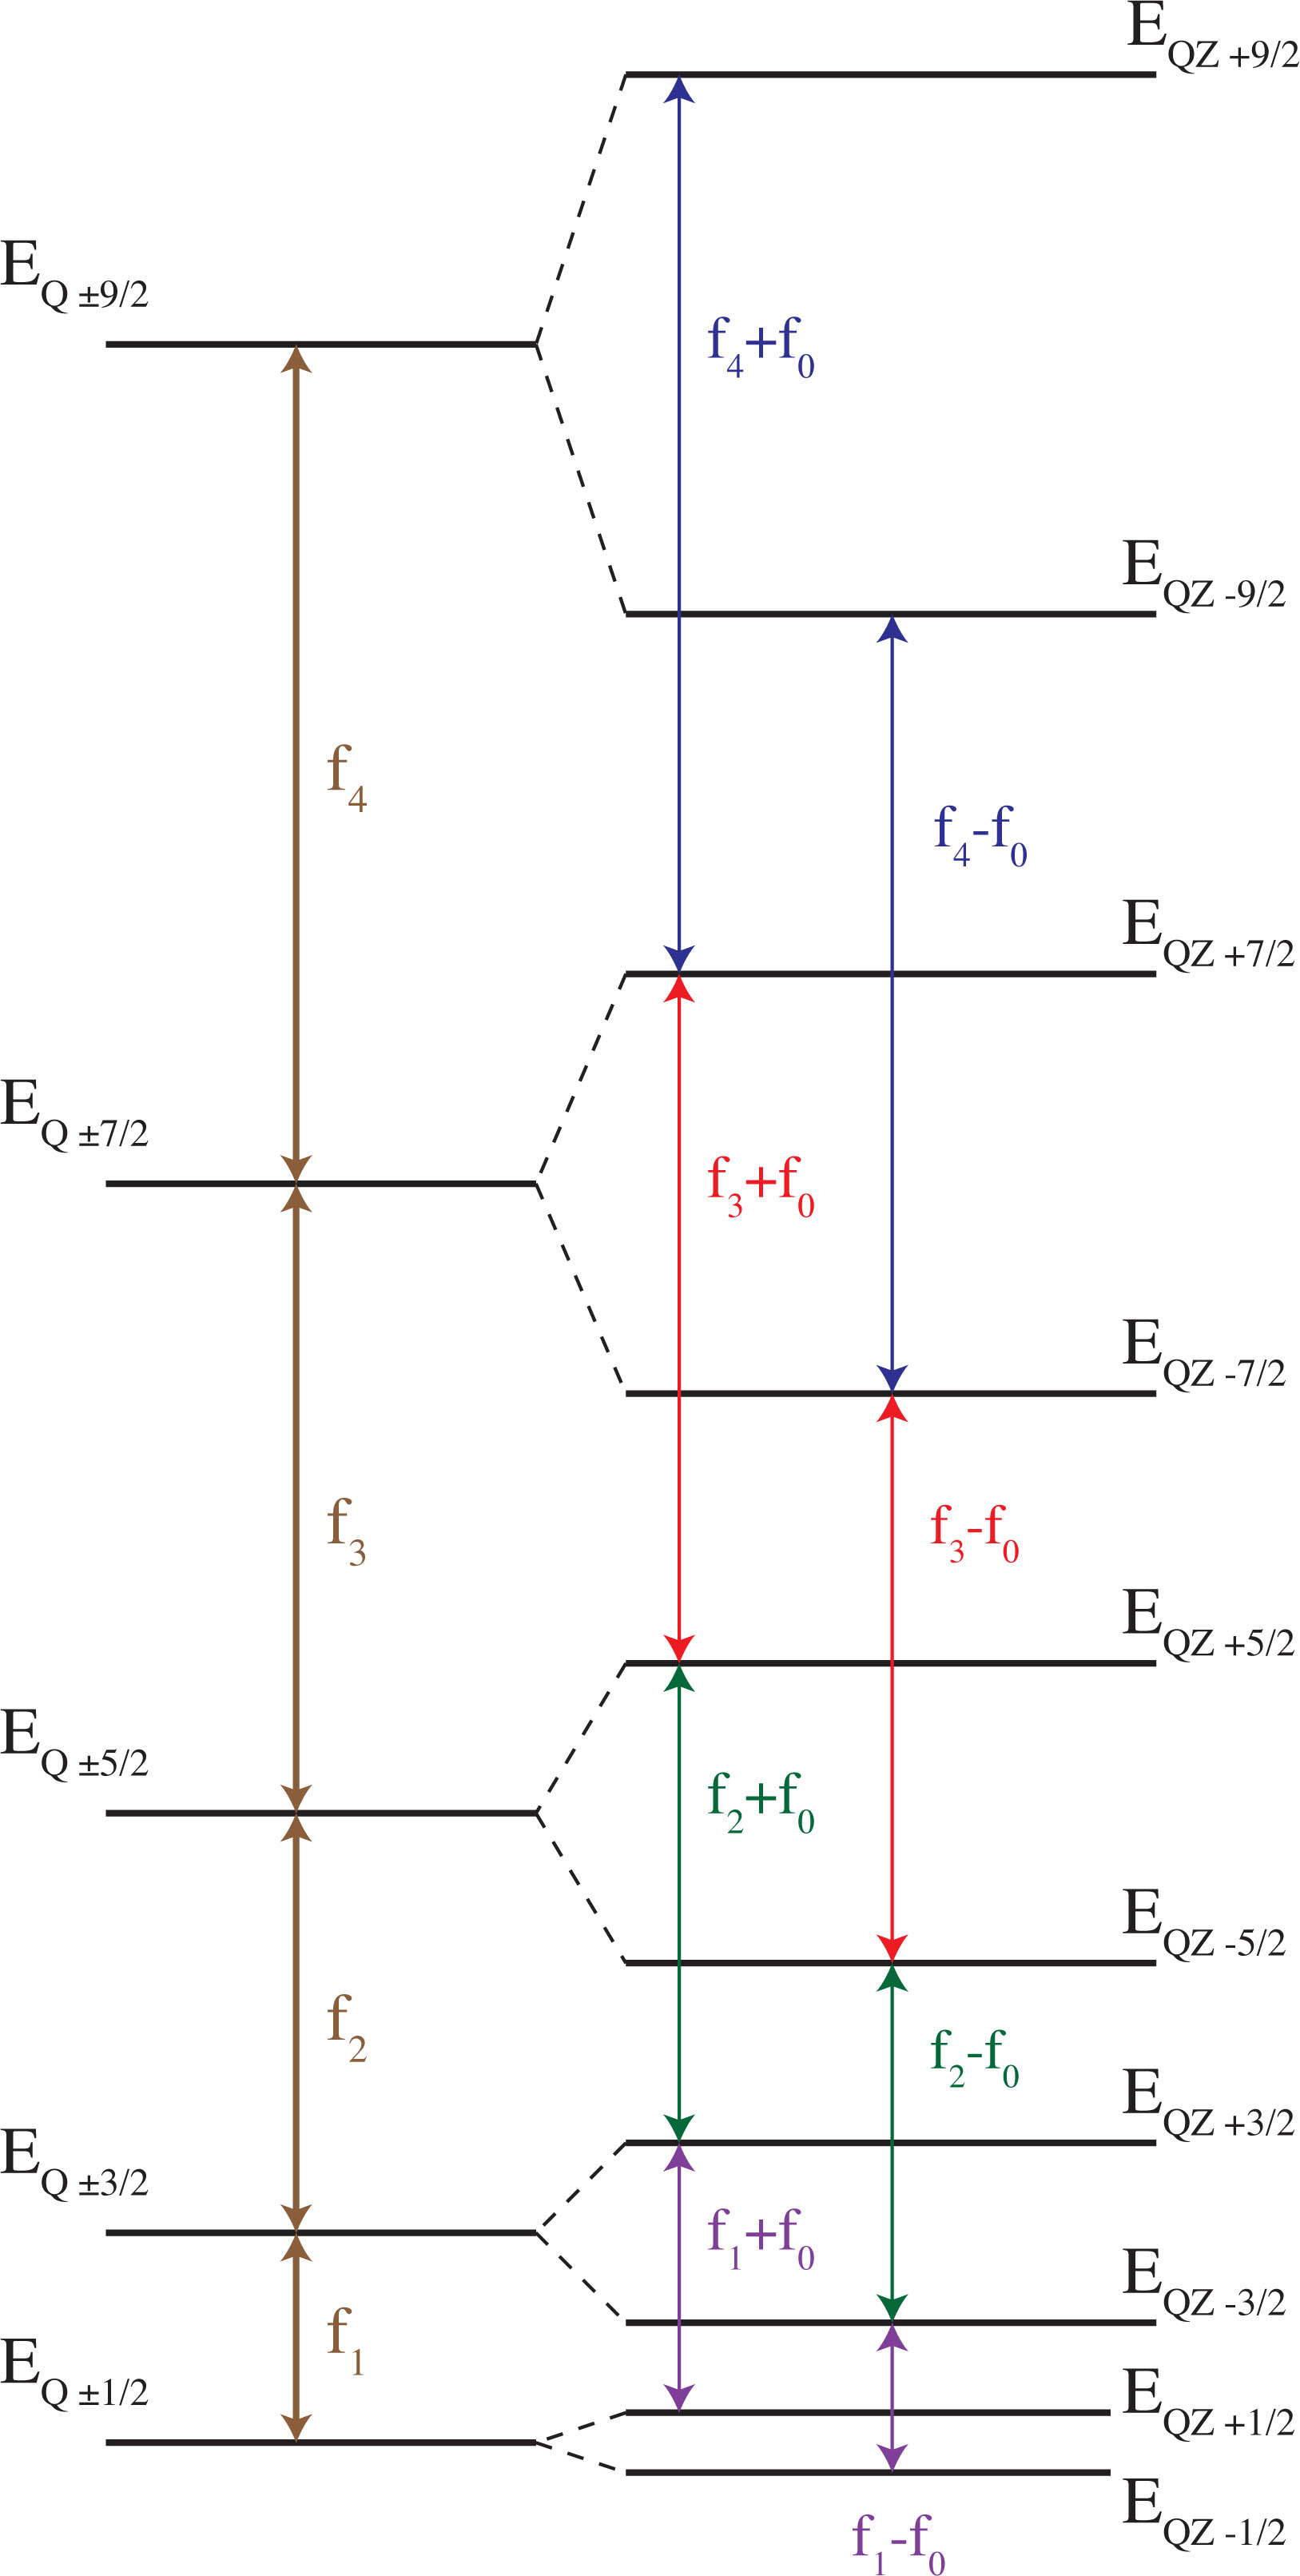
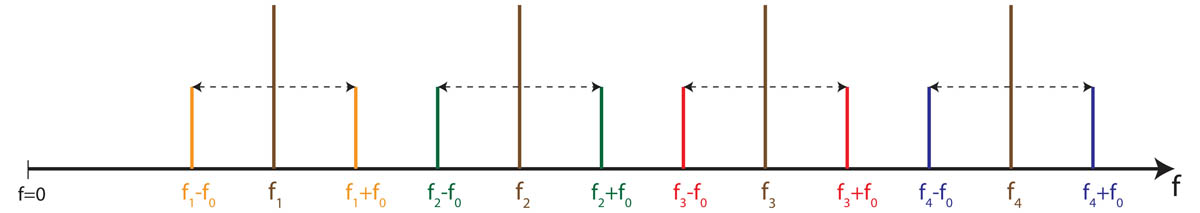
Fig. 3 shows the energy levels in the absence (EQ) and in the presence (EQZ) of a weak external magnetic field B0 for quadrupole nuclei with a spin quantum number of I=9/2 (η=0). The frequency spectrum corresponding to the energy spectrum is shown in fig 4. In the presence of B0 the pure quadrupole frequencies disappear (brown) and twice as many peaks are detectable. This is just valid for systems with perfect mono-crystalline structures. In case of powders or substances with many crystalline each peak is converted to a broad frequency distribution (pake-doublet).