Chemical Modelling

Motivation

Chemical modelling programs like Gaussian09 are a powerful tool to approximately predict molecular properties like the EFG. Their use can improve the design process of molecules with specific properties, in our case the NQR transition frequencies, significantly. Thereby it is possible to simulate chemical reactions and the changes of molecular properties. This accelerates the design process and prevents the synthesis of unsuitable molecules.

Density functional theory

In DFT (density functional theory) molecular properties like the EFG are derived from the electron density distribution ρ of a molecule. The DFT-SCF (DFT self consistent field method) is an iterative optimisation process which uses input parameters like the initial molecular geometry, basis sets and a functional [3]. A basis set is a set of mathematical functions which is used to describe atomic orbitals or the electron density distribution of molecules. Functionals are determined by empirical data and define how the optimisation process integrates the electron-electron interactions [2].

Compromises in setting up a simulation

The results of molecular modelling strongly depend on the chosen input parameters. Therefore it is recommended to choose the best basis set in combination with the largest possible crystallographic geometry. Simulations can get expensive very fast and can last up to weeks even when using e.g. 12 processors in parallel. Additionally the usage of extensive basis sets and large geometries can cause an overflow of the limited operative memory. So in most cases compromises have to be made with respect to the choice of the basis sets and the used geometry.

If the crystallographic data is available, it is recommended to simulate the whole unit cell. For some compounds it is possible to get accurate results by simulating a part of the crystal or even individual molecules. Therefore it must be checked if the environment of the atoms of interest is representative for all other atoms in the structure.

  • Operative memory: Atoms of different crystallographic sites have different EFGs as well as different quadrupolar frequencies. For compounds containing such atoms it is recommended to simulate the whole unit cell or large parts of their crystallographic structure. If the unit cell consists of many atoms, simpler basissets have to be chosen due to limitations in operative memory.
  • Molecular crystals: Molecular crystals consist of well separable molecules. Simulations with just a few molecules can give very good results at moderate cost. Because of the low computational cost and the low number of atoms bigger basis sets can be chosen.

Zincdibromide

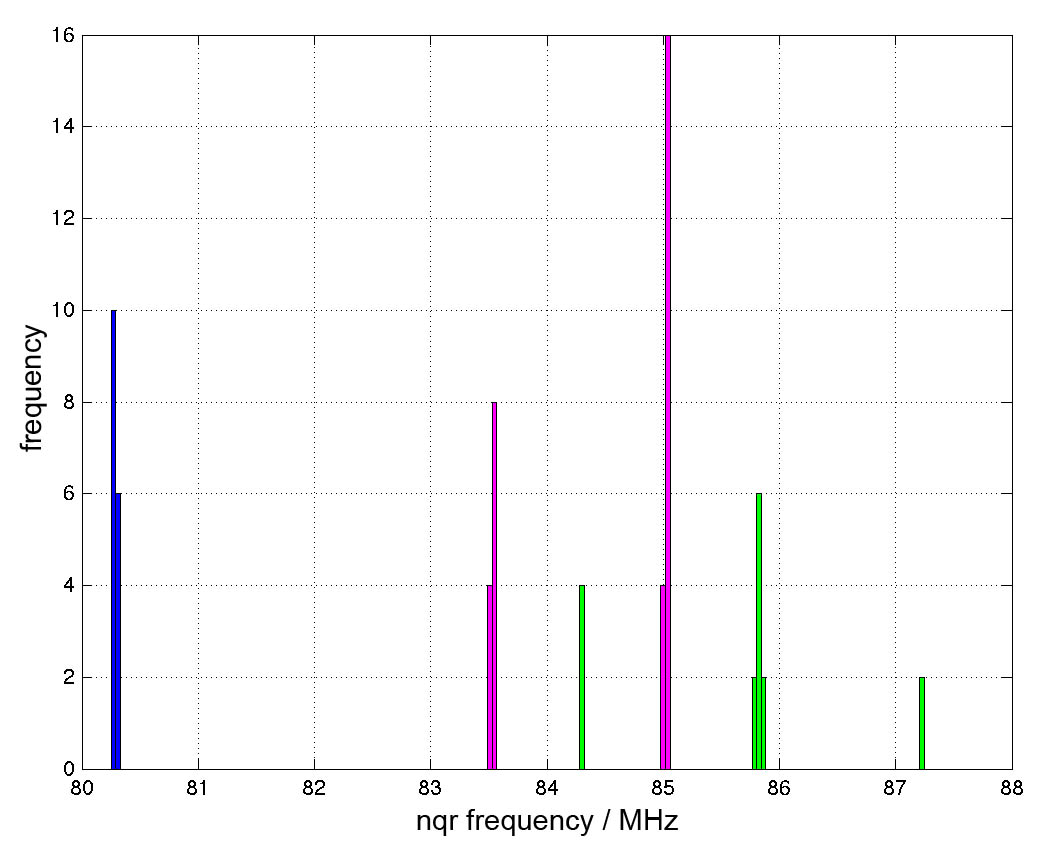
Fig. 1 shows a unit cell (left) and a subelement (right) of a ZnBr2 crystal. The unit cell contains 96 atoms and 3600 electrons. This large amount of electrons makes simulations difficult. Because of the limited operative memory simple basis sets are required.

Figure 1 shows a unit cell (left) and a subelement (right) of a ZnBr2 crystal

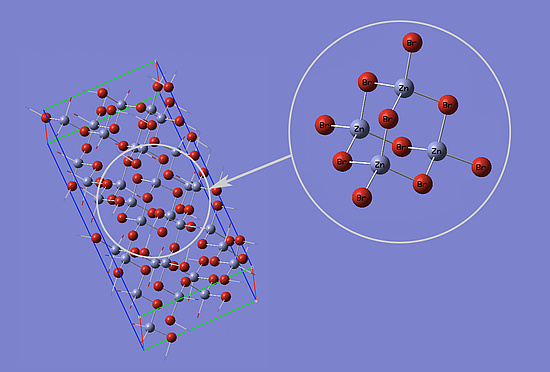
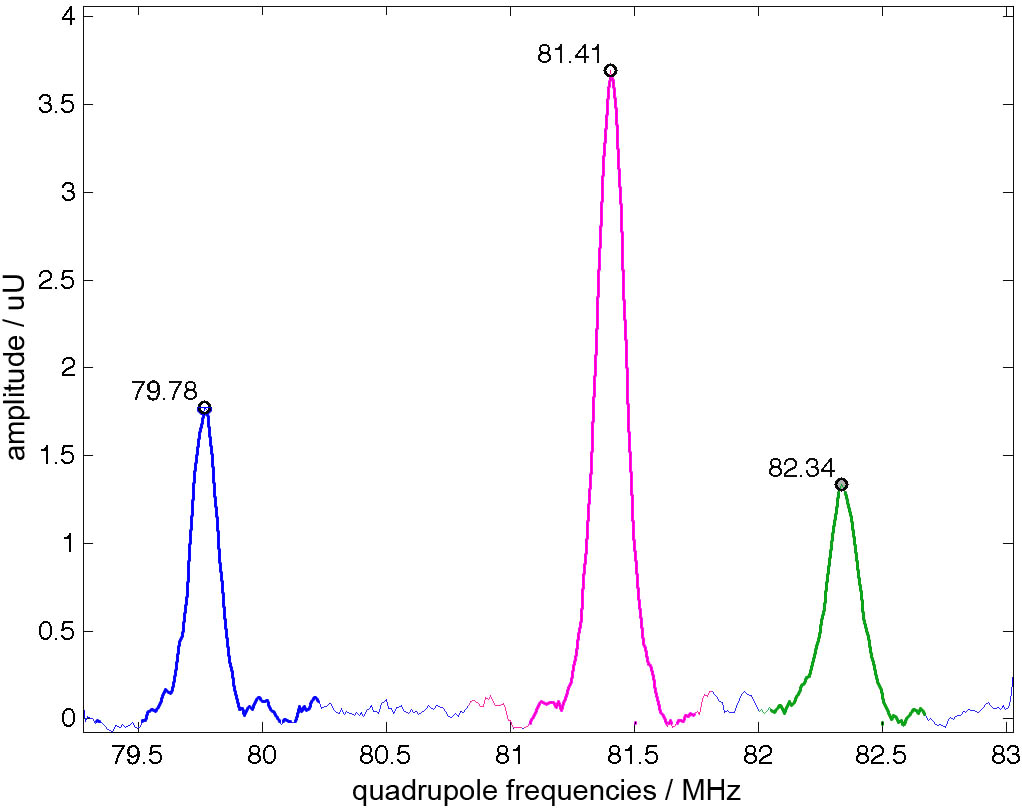
The Br atoms of ZnBr2 are located at three different crystallographic sites. This results in three different quadrupolar frequencies per isotope (79Br, 81Br). Figure 2 shows a ZnBr2 subelement. The three different crystallographic sites are coloured in green, blue and magenta. Figure 3 shows a nuclear quadrupole resonance spectrum. The three peaks correspond to the three different crystallographic sites shown in fig. 2. All results refer to 81Br.


Figure 2 shows the three different crystallographic sites of a ZnBr2 subelement.
Figure 3 shows a ZnBr nuclear quadrupole resonance spectrum.

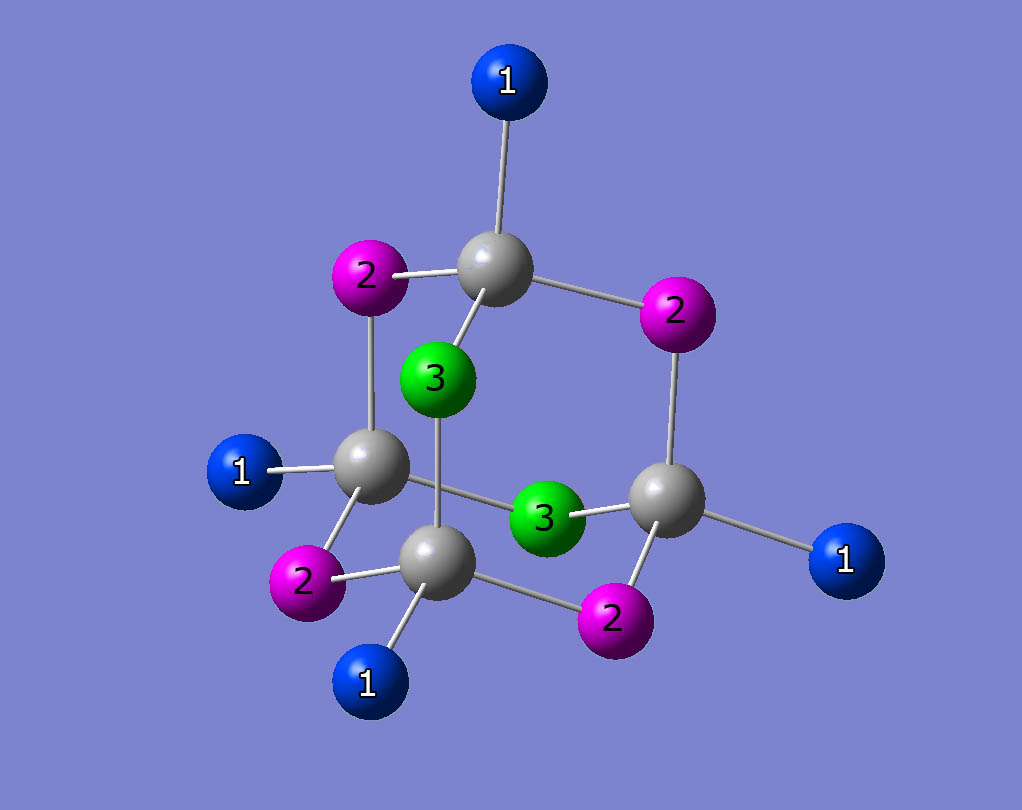
Due to the different crystallographic sites of Br atoms accurate results are just expected if the whole unit cell is simulated. Because of the large unit cell simple basis sets were chosen. Figure 4 shows a histogram of simulated frequencies. The simulated frequencies of the blue coloured crystallographic site have a small standard derivation and fit quiet good to the measured data. The magenta and the green group have a larger standard derivation and show a bigger difference to the measured data. Nevertheless are the simulated results near to the measured frequencies. Considering the limitations in choosing the basis set, the results are very good.

Figure 4 shows a histogram of simulated frequencies of a ZnBr2 unit cell.

References

[1] S. Bell, T. J. Dines, B. Z. Chowdhry, R. Withnall: Computational Chemistry Using Modern Electronic Structure Methods. Journal of Chemical Education 84: 1364-1370 (2007) [2] J. B Foresman and A. E Frisch: Exploring Chemistry with Electronic Structure Me- thods. Pittsburgh PA, Gaussian Incorporated (1996) [3] A. Szabo and N. S. Ostlund: Modern Quantum Chemistry: Introduction to Advanced Electronic Structure Theory. Mineola - New York, Dover Publications (1996)

To top