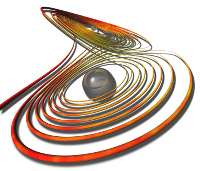
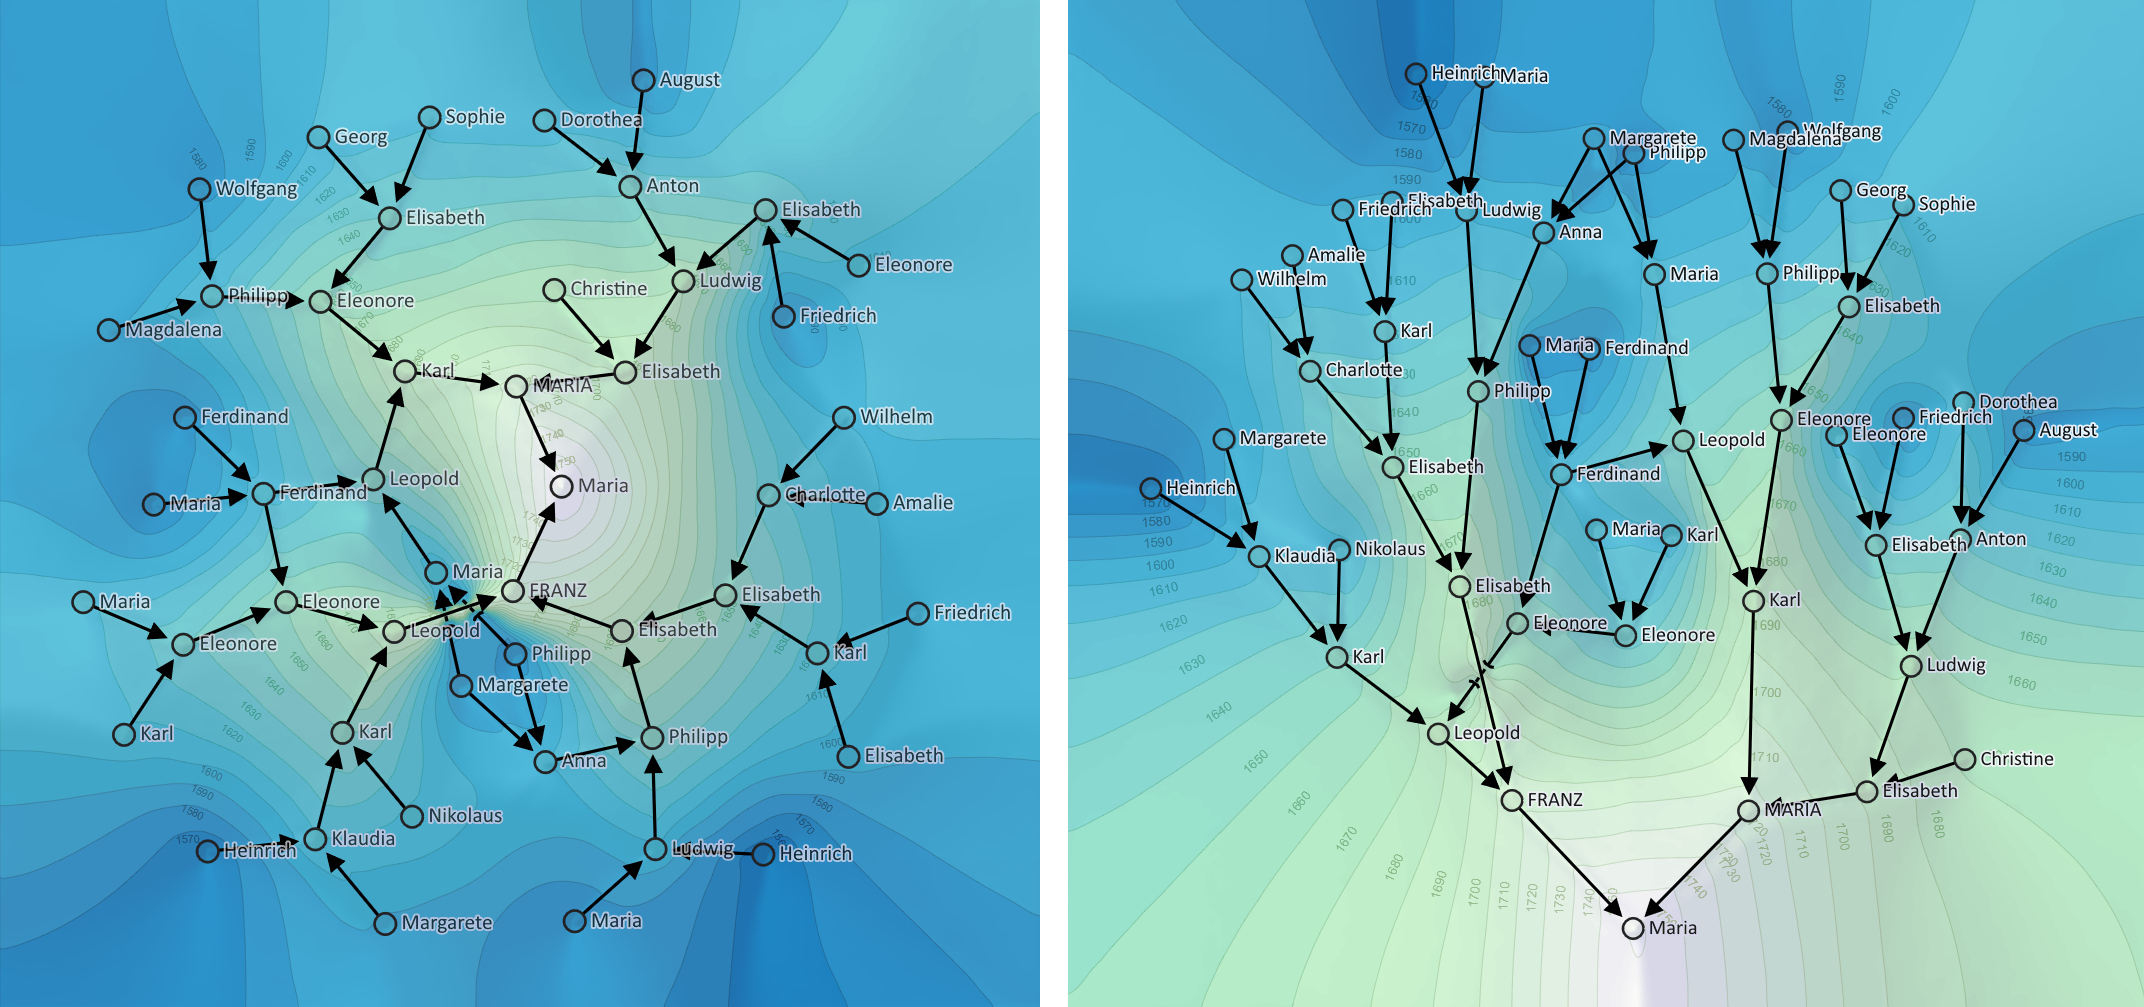
We propose a novel visualization technique for graphs that are attributed with scalar data. In many scenarios, these attributes (e.g., birth date in a family network) provide ambient context information for the graph structure, whose consideration is important for different visual graph analysis tasks. Graph attributes are usually conveyed using different visual representations (e.g., color, size, shape) or by reordering the graph structure according to the attribute domain (e.g., timelines). While visual encodings allow graphs to be arranged in a readable layout, assessing contextual information such as the relative similarities of attributes across the graph is often cumbersome. In contrast, attribute-based graph reordering serves the comparison task of attributes, but typically strongly impairs the readability of the structural information given by the graph’s topology. In this work, we augment force-directed node-link diagrams with a continuous ambient representation of the attribute context. This way, we provide a consistent overview of the graph’s topological structure as well as its attributes, supporting a wide range of graph-related analysis tasks. We resort to an intuitive height field metaphor, illustrated by a topographic map rendering using contour lines and suitable color maps. Contour lines visually connect nodes of similar attribute values, and depict their relative arrangement within the global context. Moreover, our contextual representation supports visualizing attribute value ranges associated with graph nodes (e.g., lifespans in a family network) as trajectories routed through this height field. We discuss how user interaction with both the structural and the contextual information fosters exploratory graph analysis tasks. The effectiveness and versatility of our technique is confirmed in a user study and case studies from various application domains.
Demo Code
A javascript demo implementation for rendering Topographic Attribute Maps can be found on GitHub.
Info
Proceedings of EuroVis 2020
Computer Graphics Forum
38(4), 35:1-35:11
doi: 10.1111/cgf13987
License: Open Access (CC-BY)