
Team Andrews: Information Visualisation
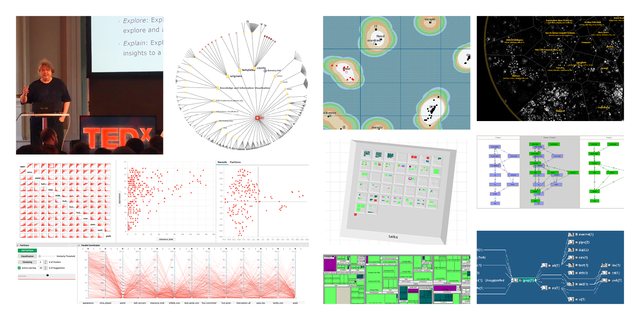
In Information Visualisation, we create interactive visual representations of abstract information spaces (tabular datasets, hierarchies, networks, etc.), in order to facilitate their rapid assimilation, exploration, and understanding by human users.
There are two main purposes for Information Visualisation:
- Exploratory visualisations to help researchers explore and analyse.
- Explanatory visualisations to present results and insights to a wider public.
Interactive, web-based data visualisations have become increasingly important. To ensure our visualisations are intuitive, we carry out usability evaluations.
Team Leader: Keith Andrews
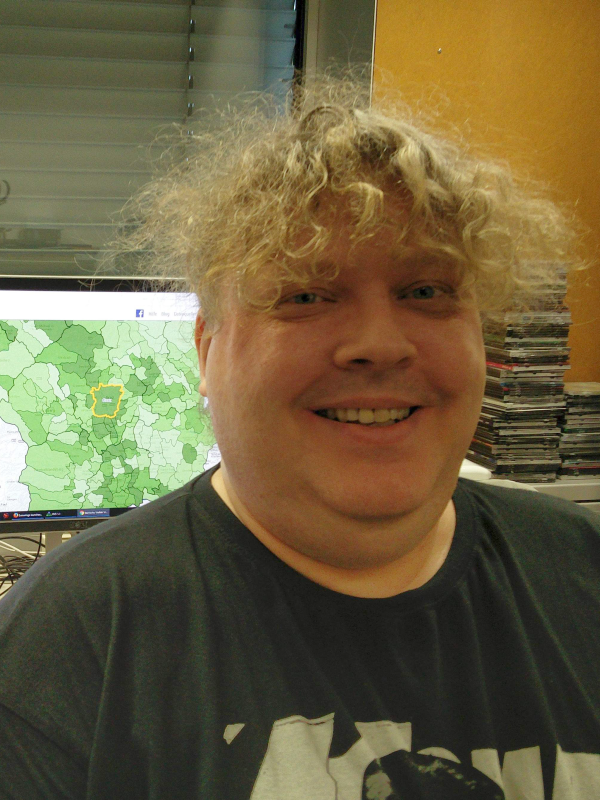
+43 316 873 5610
kandrews@iicm.edu
Business Card
Personal Page