Instrumentation
In principle high quality NQR spectra can be obtained with commercial NMR spectrometers. In fact, most experiments involving NQR are done in solid state NMR. However, there are several drawbacks limiting the use of such devices when searching for yet unknown spectral peaks [3]:
- Standard NMR probeheads are resonators with a very small bandwidth (typically several 100 ppm) and changing the central frequency usually requires changing the probehead or at least re-tuning and re-matching which makes a wideband sweep very cumbersome [3].
- Most substances under test will be available in form of powders. However, when measured in an NMR spectrometer, NQR spectra only show sharp and definite peaks when the orientation of the EFG tensor with respect to the probe coil is the same for all nuclei, which is only the case in monocrystals. In the presence of a strong B0 powders exhibit a considerable broadening of the peaks and in the case of nuclei with high spin quantum number (7/2, 9/2) and high quadrupole moment the broadening can even make the signals undetectable [2][4]. In the absence of a B0 the NQR spectra are always distinct and there is no loss of SNR due to broadening [3].
- Commercial zero field NQR spectrometers are not widespread. Wideband probeheads used so far typically consist of NMR resonators which are automatically tuned and matched for each frequency point of the spectrum to be acquired. Though this approach provides the best possible SNR it has one drawback: Automatic tuning and matching a transmit coil at power levels around 100W and more require mechanically tuneable high-voltage capacitors controlled by stepper motors [5]. This makes the probeheads large and complicated and they can only be operated from a special NMR console which provides the stepper motor control interface and an automatic tuning algorithm [3].
Our aim was to develop a low-cost wideband zero-field NQR coil without the need for tuning and matching. We developed prototypes for a spectral range between 75 and 145 MHz. The price to be paid for a wideband design is a comparatively low Q-factor and thus a worse SNR than that of a resonator. However, at VHF frequencies the NQR signals are frequently strong enough so that highest possible SNR may not be essential. Fast screening of several substances for only locating the NQR peaks thus is also possible with a lower Q-factor [3].
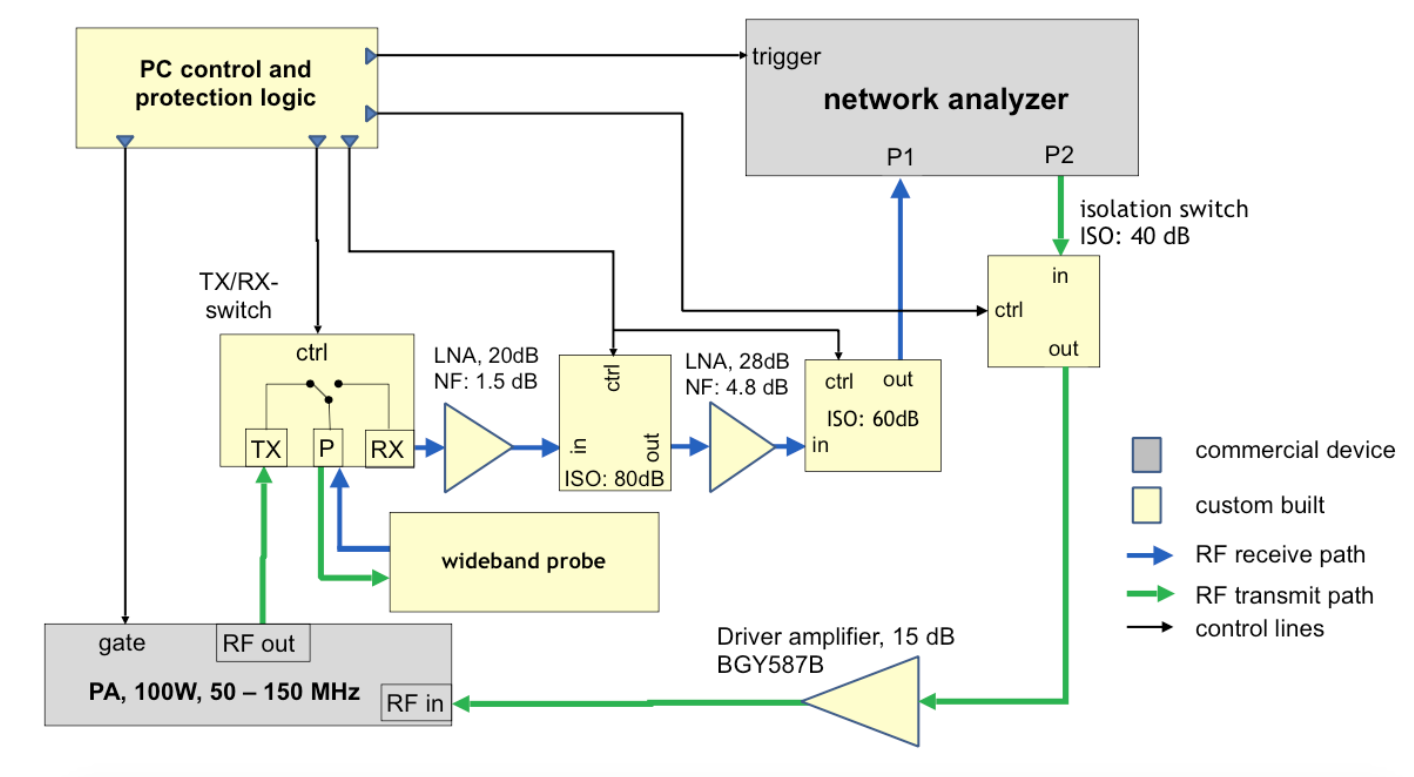
At the institute of Medical Engineering a dedicated zero-field NQR spectrometer has been developed which is equipped with special ultra-wideband probeheads.
Wideband probe
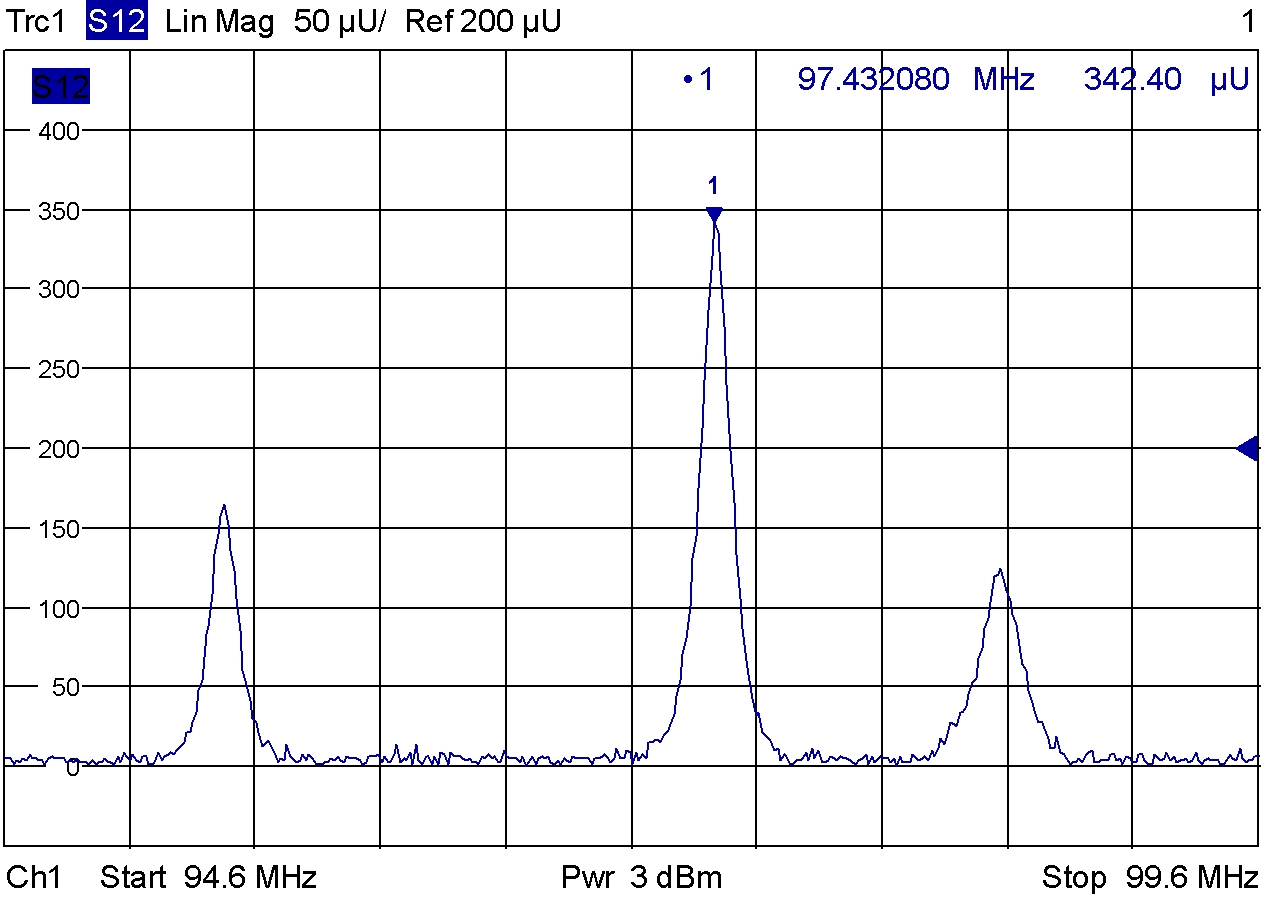
The probehead is a TX/RX coil and forms part of a reactance network which approximates an exponential transmission line. The network is terminated by a low resistance which dissipates most of the RF energy fed into the network by the power amplifier. In this way the input reflexion coefficient remains low over a wide bandwidth of several tens of MHz without the need for tuning and matching. This concept allows for the construction of robust and simple probeheads. The price paid for the simplicity is a lower SNR thanthat found in resonating circuits. However, for sufficiently concentrated samples with volumes between 400 and 1000 microliters the signal strength is usually high enough for a fast scanning of the NQR spectrum. Fig. 3 shows an example spectrum of the 79Br isotope in a sample of ZnBr2 measured with the spectrometer. See [3] for further reading.
References